Why and how to make a project plan drawing
Part four of our Visual Thinking Strategy Series
Why and How To Make a Project Plan is part four of Our Visual Thinking Strategy series. You can find part one here, part two here, and part three here.
We’ve reached the final stage in our visual thinking strategy for solving problems and achieving goals! You’ve done your research, you’ve come up with ideas, and now it’s time to plan. There are many, many ways you could format your strategy plan, so we’ll walk you through one option, and show an alternative example at the end.
Tools for your project plan drawing
If you’re working on smaller format paper, you may want to work across multiple pages to allow for enough room to draw. If you’re working on a larger format, one page will work.
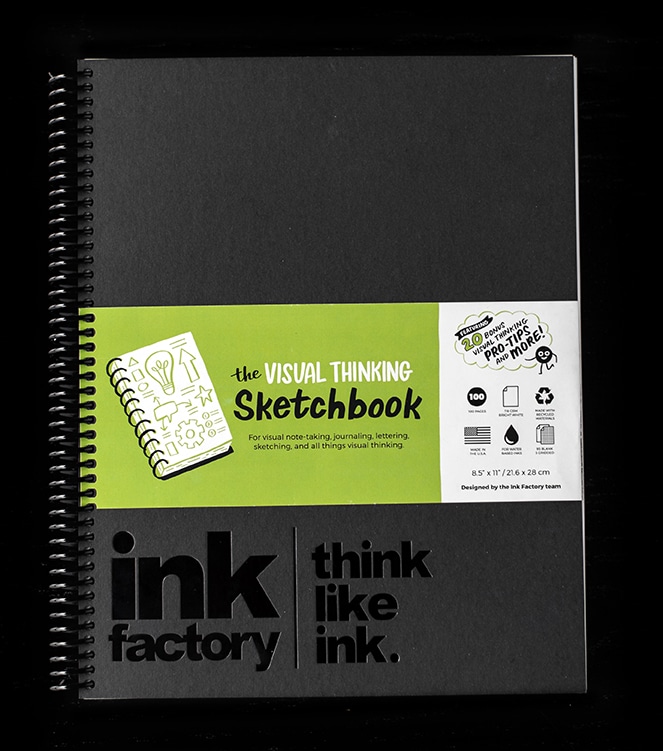
The Visual Thinking Sketchbook
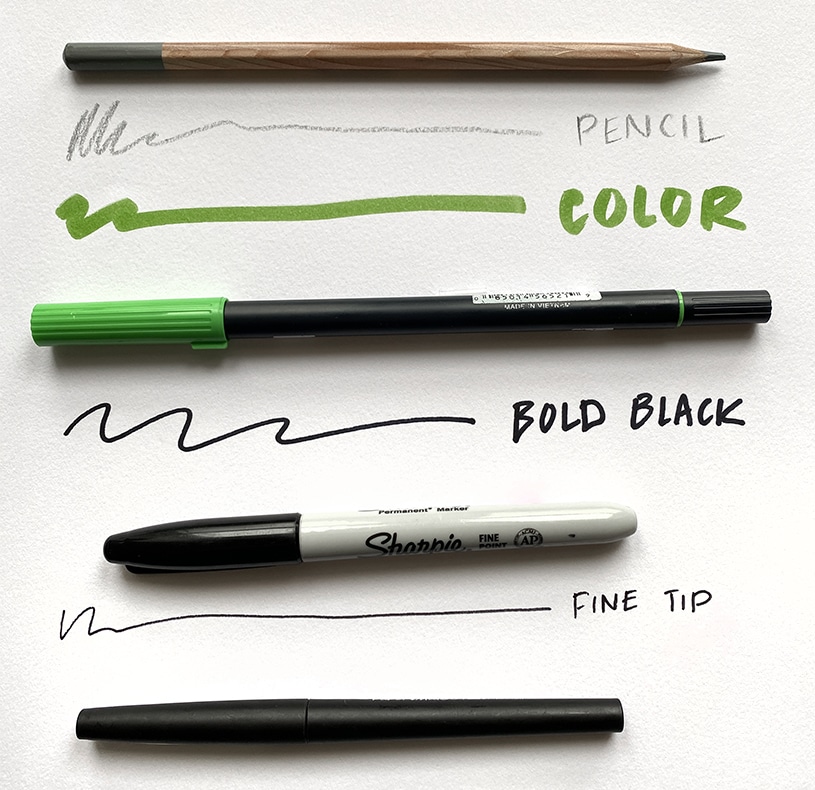
You may also want to sketch things out with a pencil, analyze your plan and make sure you’re happy with it, and then draw over it with a marker to create your final version. Chances are, your plan may develop and change as you add more content to it.
How to Start Your Project Plan Drawing
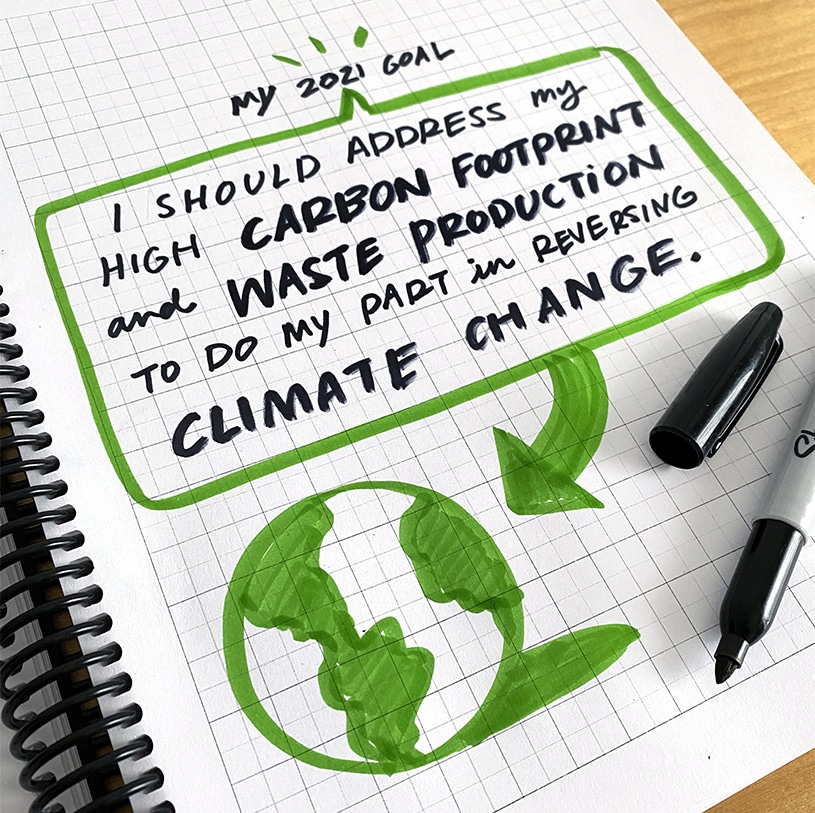
In our example, the overarching problem statement was:
“I want to address my high carbon footprint and waste production to do my part in reversing climate change.”
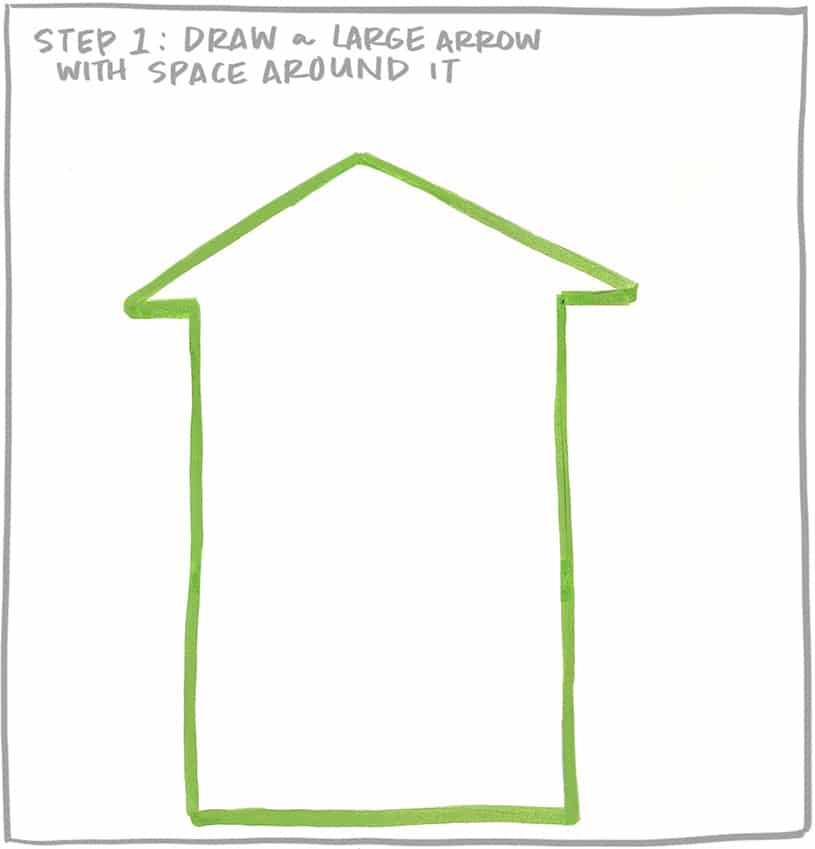
Because we’re planning for a future state where we’ve reduced our carbon footprint, we’re using an arrow as the container for our strategy, with our goal at the end. The arrow has to be large enough to contain the strategy, so draw a large arrow in the middle of your page, with some space at the top.
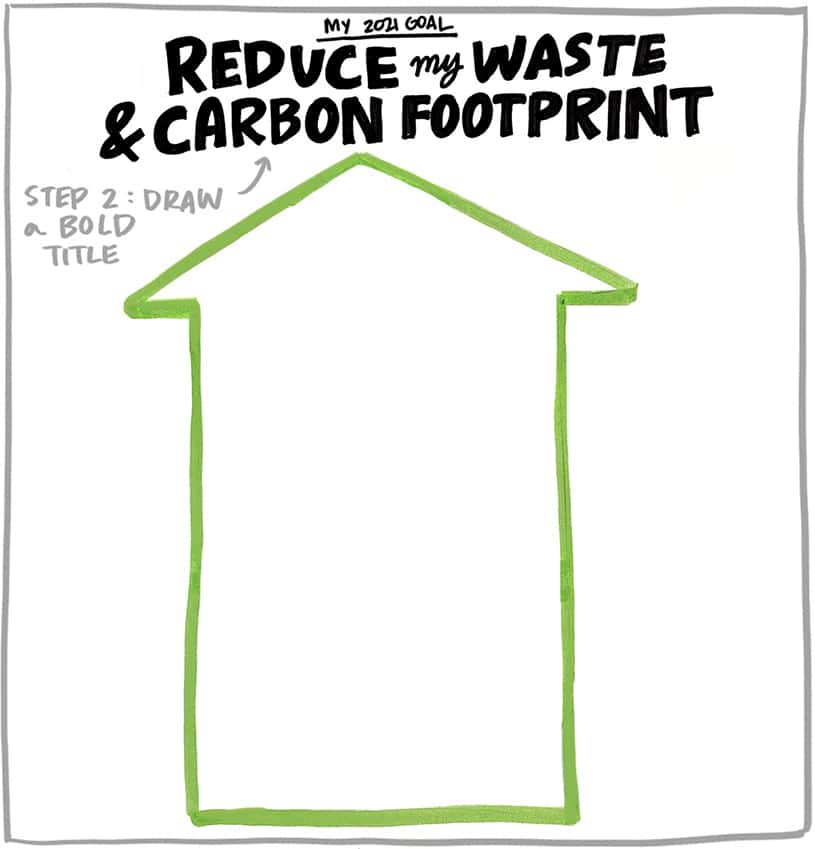
For our visual plan, we’re going to simplify the statement to “Do my part to reverse climate change.” Having a less wordy statement will be easier to write out, and it will pop visually. Having your ultimate goal visible on your plan is an important visual reminder, as your entire strategy should always map back to it.
Through our research, we came up with four sub-goals that would enable us to tackle our goal:
- Eat less meat
- Support environmental non-profits
- Reduce waste
- Conserve energy
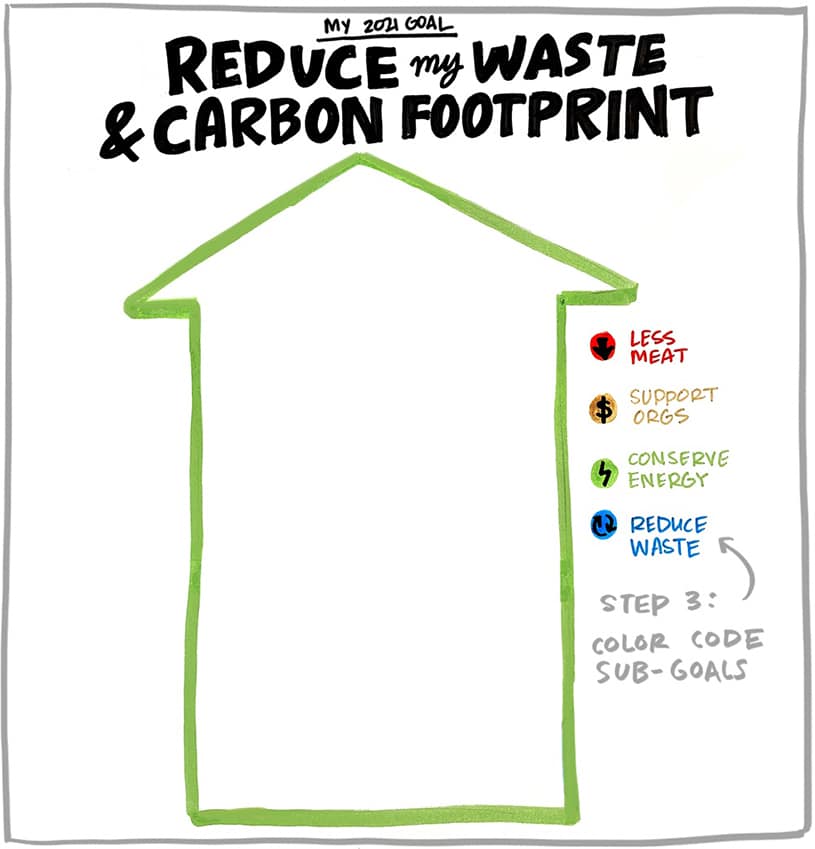
Because each of the sub-goals are fairly different, they will each have their own set of tasks needed to achieve them, but they’re not necessarily dependent on each other. So you can work on these multiple sub-goals all at once. We’re going to color-code our tasks to map back to each of these sub-goals by creating a key to the right of our arrow.
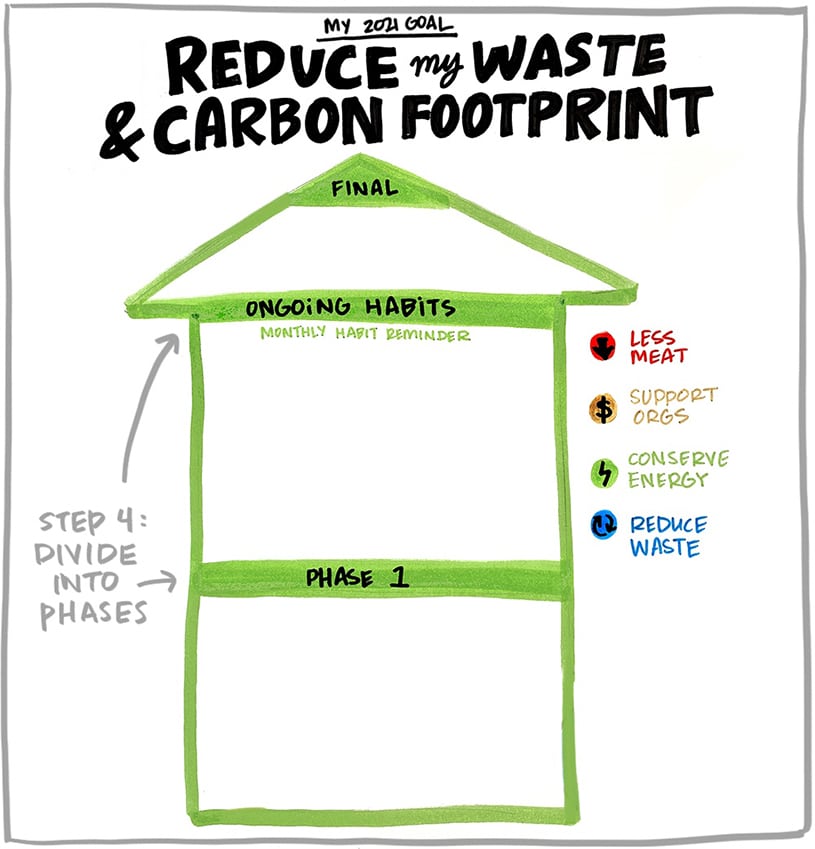
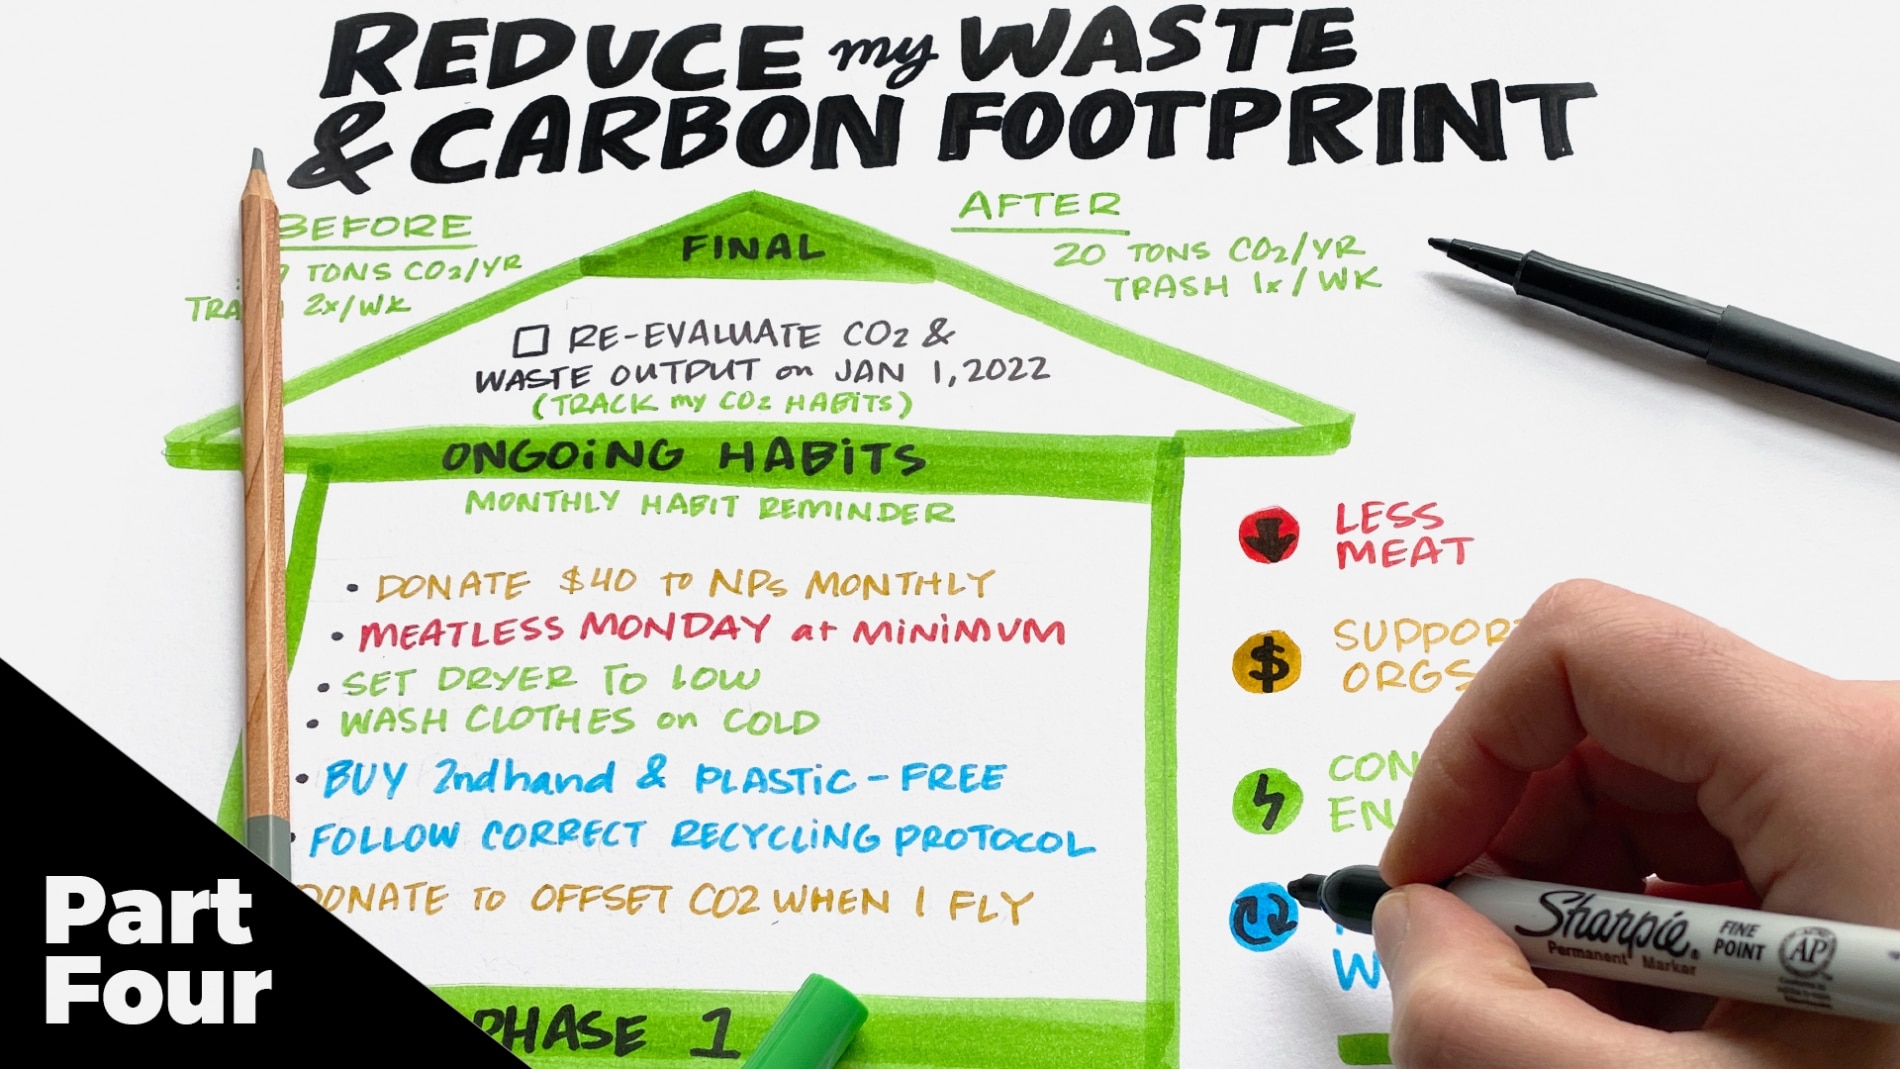
Next, we’re going to divide our plan into phases. Based on our brainstorm from the last exercise, we’ll have a good idea of all the tasks we need to execute on this goal, and what categories they fall into. For this example, we’re calling tasks we can achieve immediately “phase 1,” tasks that need an ongoing commitment are the next step, and will be called “ongoing,” and tasks that enable us to evaluate if we’ve achieved our goal will be called “final.” Divide your arrow up and label each phase, top to bottom.
Your phases will depend on what your goal is–you may have a different number or type of phases than our example. Alternatively, if your sub-goals were chronological, you could divide your area into sections, one for each sub-goal.
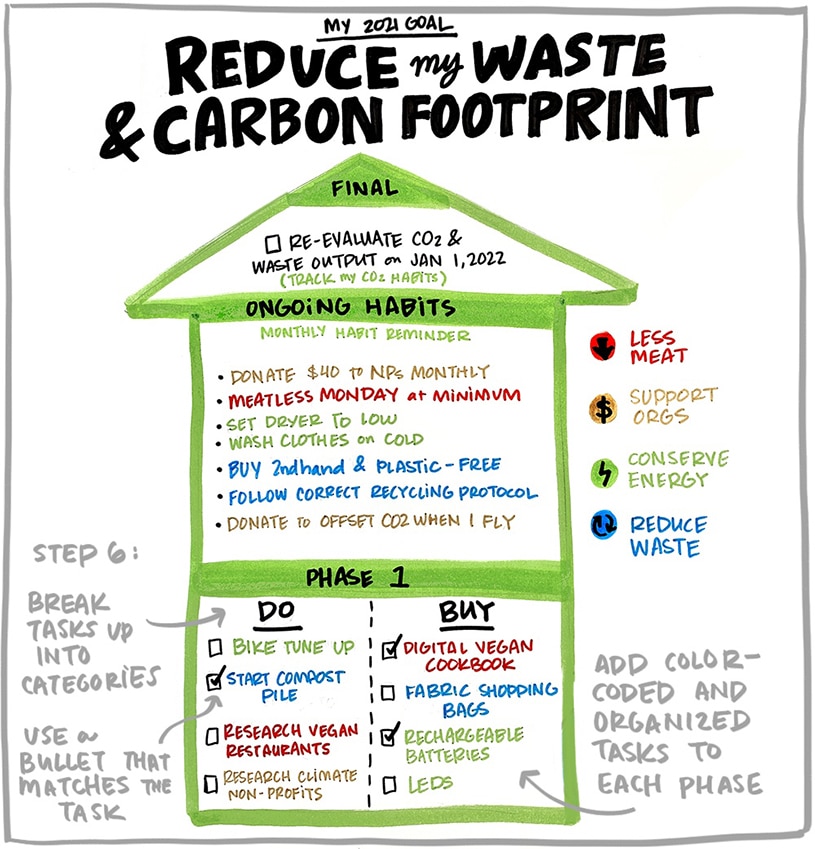
Break up tasks by type
Next, we’ll populate each sub-goal section with the tasks we need to take to achieve that goal. Within each sub-goal, you may have one-time tasks or ongoing tasks. You may also have easy to achieve, single tasks, and longer-term, more difficult tasks.
Start by creating a sub-section for more difficult tasks. Write your tasks here, while thinking through how each one can be broken down into smaller, more manageable tasks. Write those smaller tasks in a section underneath. A task that is one-and-done can be checked off, while an ongoing task should always be visible on your plan. In our example, we broke phase 1 down into 2 sections: tasks to do, and items to buy. Both function like a checklist, so the user can see their progress and what they have left to do or buy.
Repeat that process for your remaining subgoals. You can have your visual research and ideation on hand to help with this process.
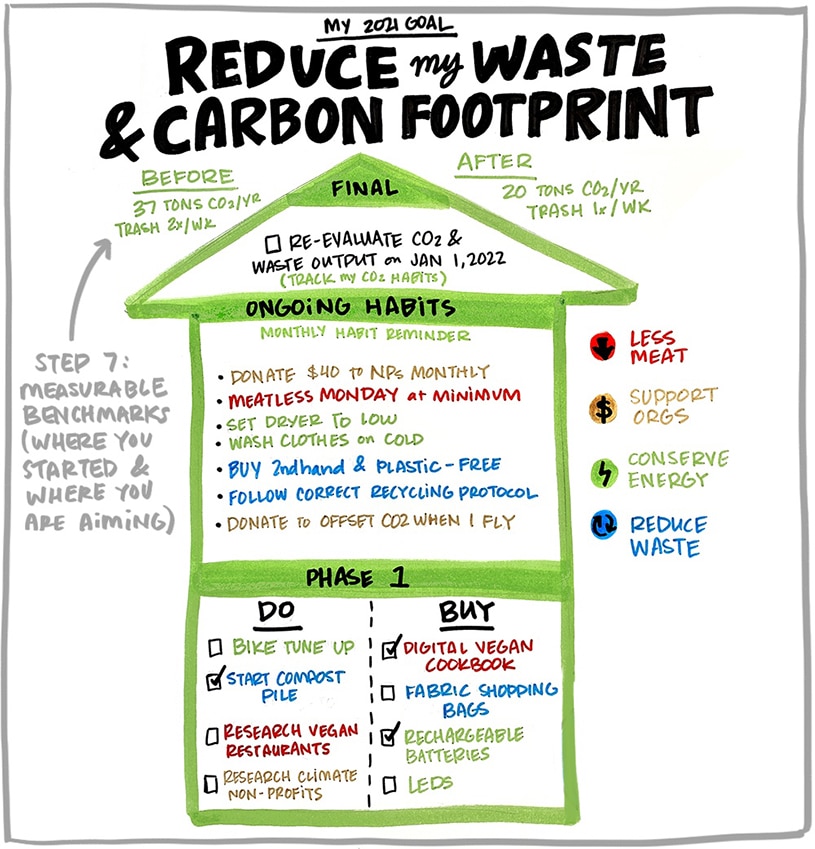
Add benchmarks
Fans of the SMART goals methodology always recommend creating measurable goals. You can add specific metrics or benchmarks around your goal to your visual plan! In our example, we put our metrics near the title and included current benchmark numbers as well as our ideal metrics.
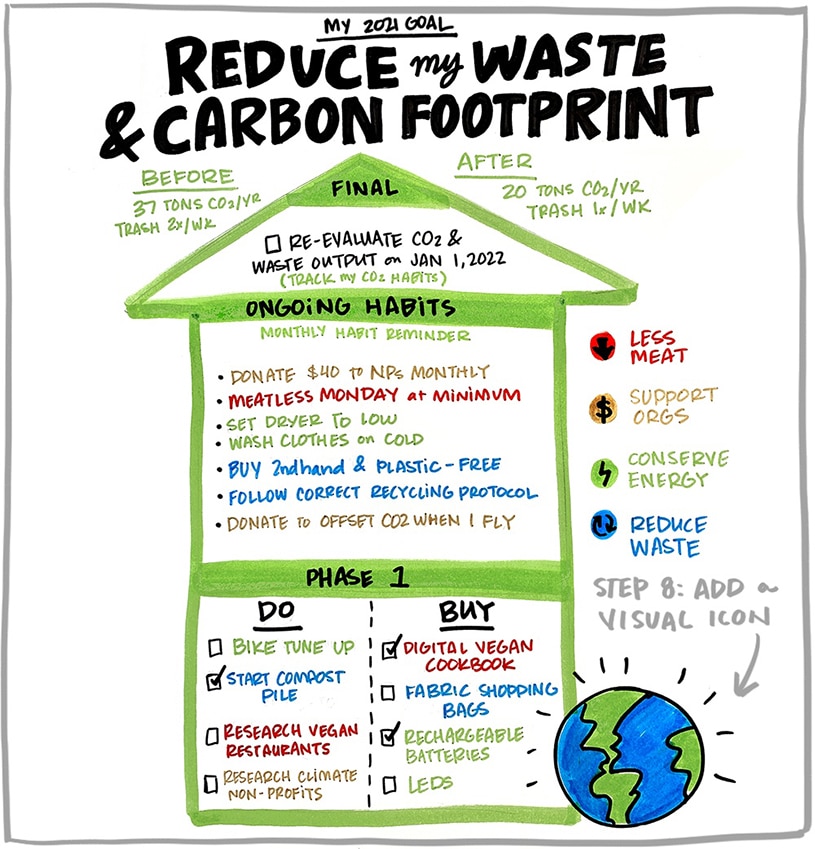
Finish with a visual
A simple, easy-to-draw visual icon adds context and visual interest to your visual strategy! Learn more about drawing simple visual icons here.
When your strategy visual is finished, take a step back, and review it. You may want to set it aside and come back later to make final changes. We recommend sketching your plan out with a pencil first, and then inking it with markers after you’re happy with your final design. And of course, you can always add some visual interest by adding an icon or two to illustrate your goal!
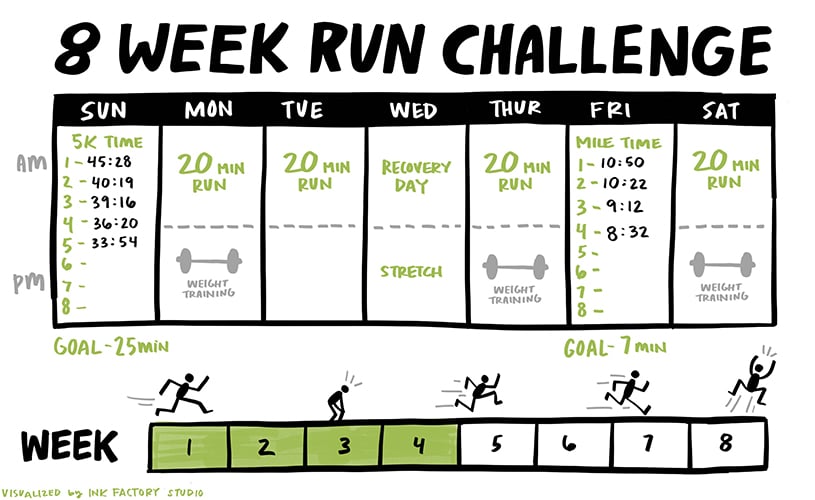
Not all visual plans will look the same
You can adapt the steps in our process to fit any goal. Here’s an example of a simplified plan with a more basic goal–an 8-week running challenge!
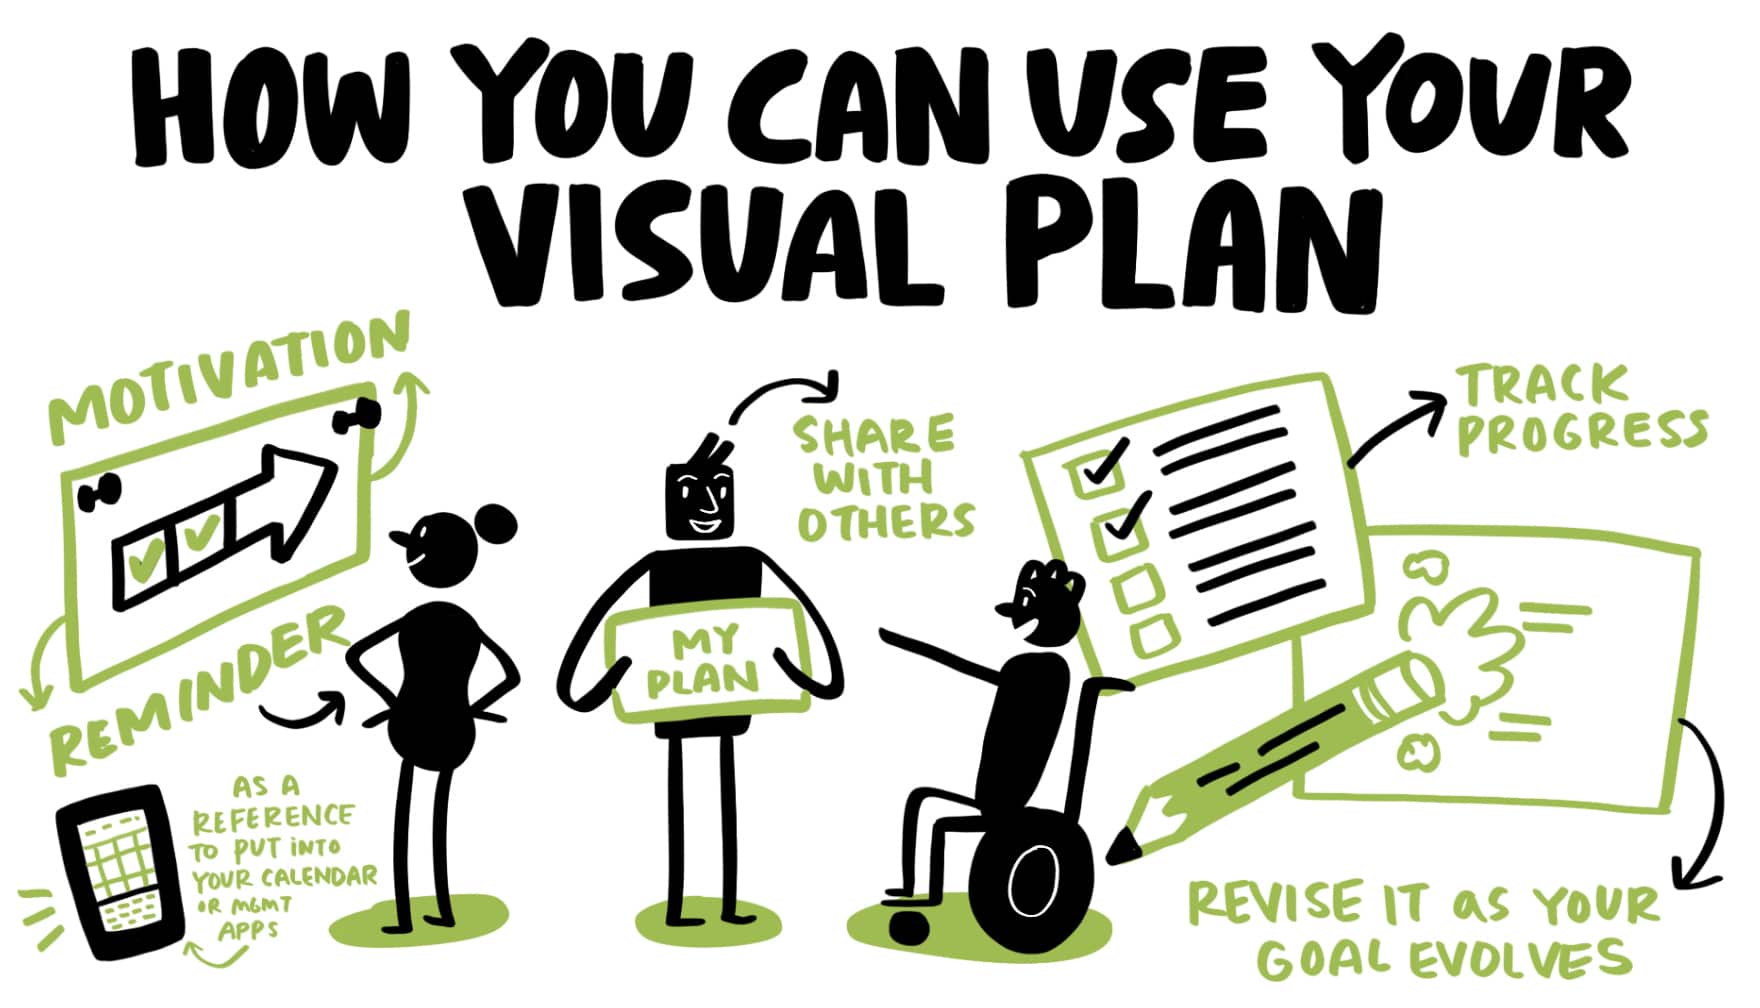
When you’ve finalized your visual, you can use it in the following ways:
- Physical checklist in your workplace
- Visual motivation for accomplishing your goals
- Guide for putting in tasks to other tools, like your to-do list or calendar
You can also share your visual plan with others, which can:
- Help keep you accountable
- Share your vision with them to explain any changes in your behavior or lifestyle
- Help them take similar actions if they are interested in the same problems and goals
Wait, there’s more! Subscribe to the Ink Factory newsletter to learn the latest on visual trends.
With a community of 4,000+ visual thinkers, you’ll be in good company. Join us!